Detecting space weather for the power grid
Jonathan Spencer Jones
Posted on: 7 May 2026
US scientists have mapped the country’s electrical structure to determine new clues about the Earth's interior and potential risks to the power grid.
Space weather is of growing interest to power system operators, alongside the local weather on Earth, for the impact it can have on the electricity system.
Much effort is being put into advancing space weather forecasting from space – but now scientists at Harvard’s Centre for Astrophysics report having developed tools to detect solar storms before they strike based on the electrical structure of the Earth.
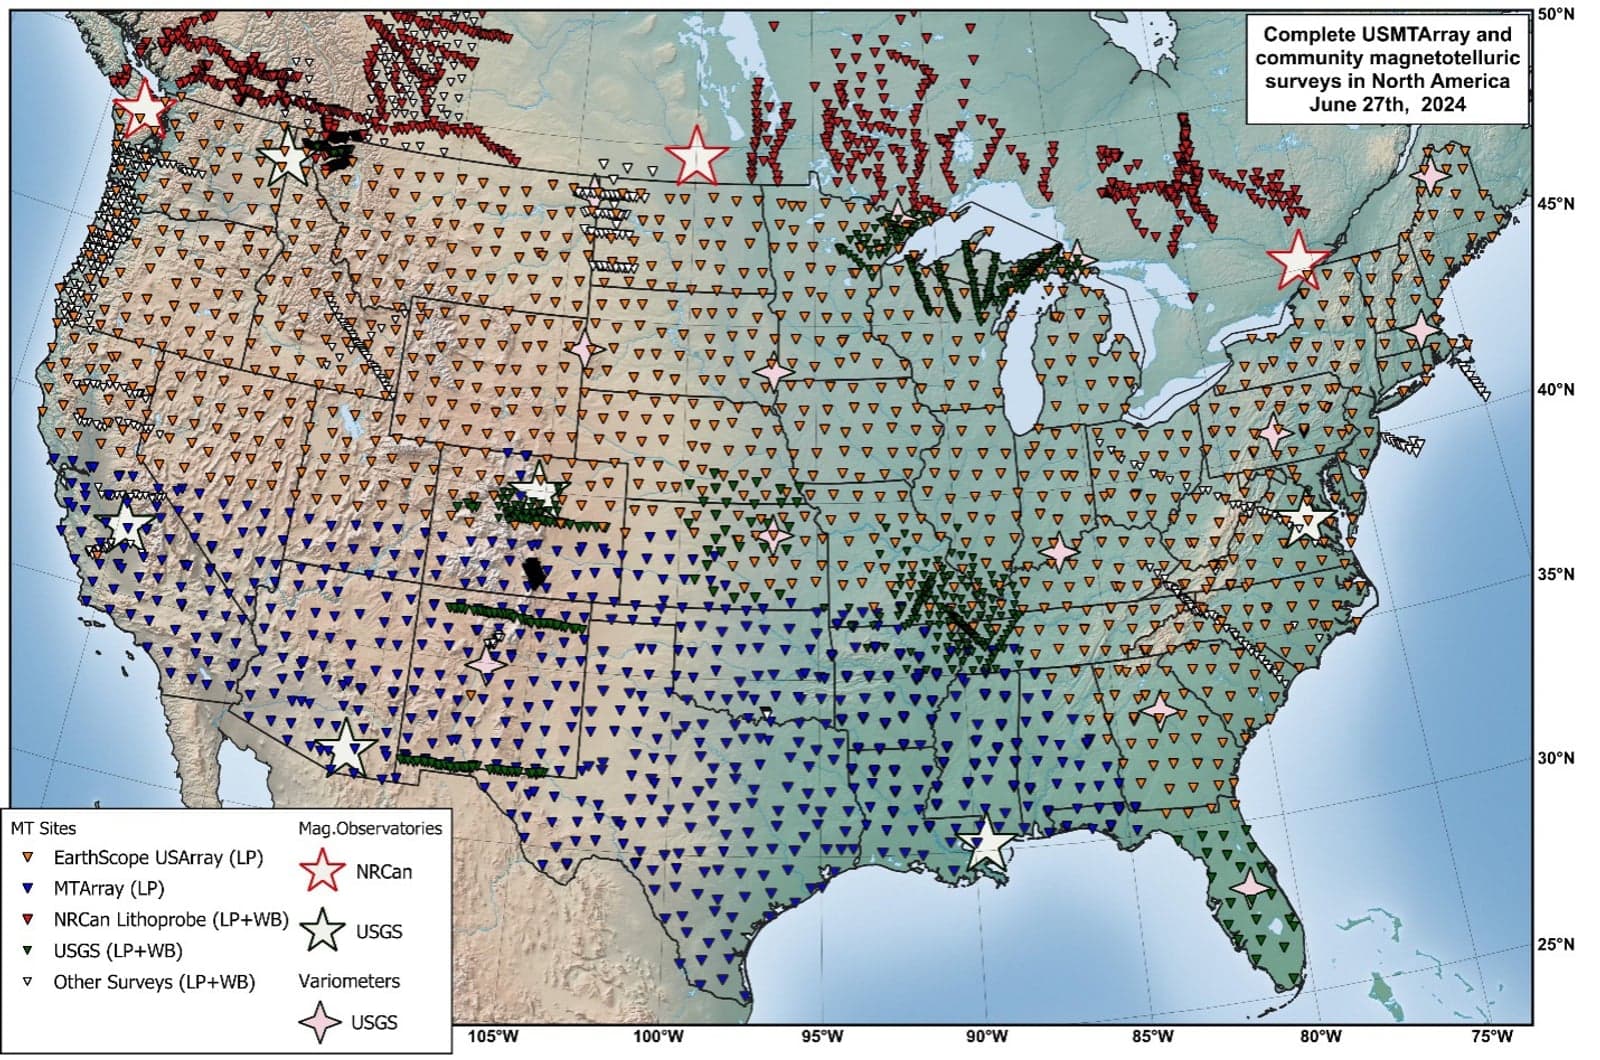
The research draws on 18 years of data from the US magnetotelluric array (USMTArray) study gathered at over 1,800 locations over an approximately 70km grid across the continent.
From this the scientists have built a three-dimensional electrical resistivity map tracing how electrical currents flow through the underground rocks, fluids and geological formations that shape North America from below.
Also of interest
Why space weather is the next frontier for grid resiliency
"Magnetotelluric data, which measures natural electric and magnetic field variations on the Earth's surface to map subsurface electrical resistivity, responds very strongly to things like fluids and melt," explains Anna Kelbert, an Earth Science Project Scientist at the CfA and the lead author of the paper reporting the findings.
“That gives us a fundamentally different window into the Earth compared to seismic data."
The practical application is that as mineral composition, fluids and temperatures all affect how electricity moves underground, when a geomagnetic storm strikes, energy from the Sun can set off electrical currents that travel through the ground and into the power lines.
A well known example is the 1989 blackout in Québec, Canada, which resulted when storm-driven geoelectric fields overwhelmed the Hydro-Québec power grid.
Real time storm monitoring
The scientists state that an important application of the USMTArray data and the models of Earth-surface impedance derived from these data is for retrospective and real-time estimation of geoelectric fields induced in the Earth during magnetic storms.
For the 1989 storm they have calculated that the geoelectric field amplitudes reached 22.79V/km at a site in Maine – far beyond what the power infrastructure is built to handle.
Kelbert continues: "I believe that anything above 1V/km is considered a threat by the power grid industry. For anything like 20V/km, if the geoelectric field of that amplitude was oriented along a typical 200km power line in Maine, we'd be looking at voltages of 4,000V, which would be driving a strong quasi-DC current across that line."
Overall, the USMTArray brings a new level of precision to the ability to warn about these hazards, the scientists say.
Whereas previously the reliance was on simplified, one dimensional models of how electricity moves through the ground, the real geology is far more complex, with the geoelectric hazards found to vary dramatically, even between locations a few kilometres apart.
For example, in the 1989 storm at one site in Virginia 19.27V/km was attained while at another in the state only 0.03V/km.
Today, data from the USMTArray feeds into a real-time risk map, managed by the National Oceanic and Atmospheric Administration (NOAA) and the US Geological Survey (USGS), that monitors electric fields across the country as storms unfold.
The fine spatial detail provided by the model should allow for targeted real-time reconfiguration of the power grid system to avoid power failures and transformer damage.
To this end, the NOAA-USGS geoelectric field model team is now working with industrial partners to facilitate real-time use of the model in operational decision making.
This also is where data recorded in space will come in, with the ability to detect storms and determine where they will impact well before they reach the Earth.
The USMTArray project was launched in 2006. In addition to real time risk monitoring of space weather hazards – an outcome that was not anticipated at its start – the mapping also is expected to become a valuable tool for finding resources such as mineral deposits and underground sources of heat.